Project 1 · Completed portfolio project
E-commerce Sales & Delivery Analytics
Brazilian e-commerce data analyzed with Python, SQL, and Power BI.
This portfolio project uses a public historical Brazilian e-commerce dataset to demonstrate how raw order, customer, product, and review data can be transformed into reporting-ready datasets and interactive business dashboards.
Workflow
- Public CSV datasets
- Python/pandas ETL
- Validation & reconciliation
- SQLite & processed CSVs
- Power BI dashboards
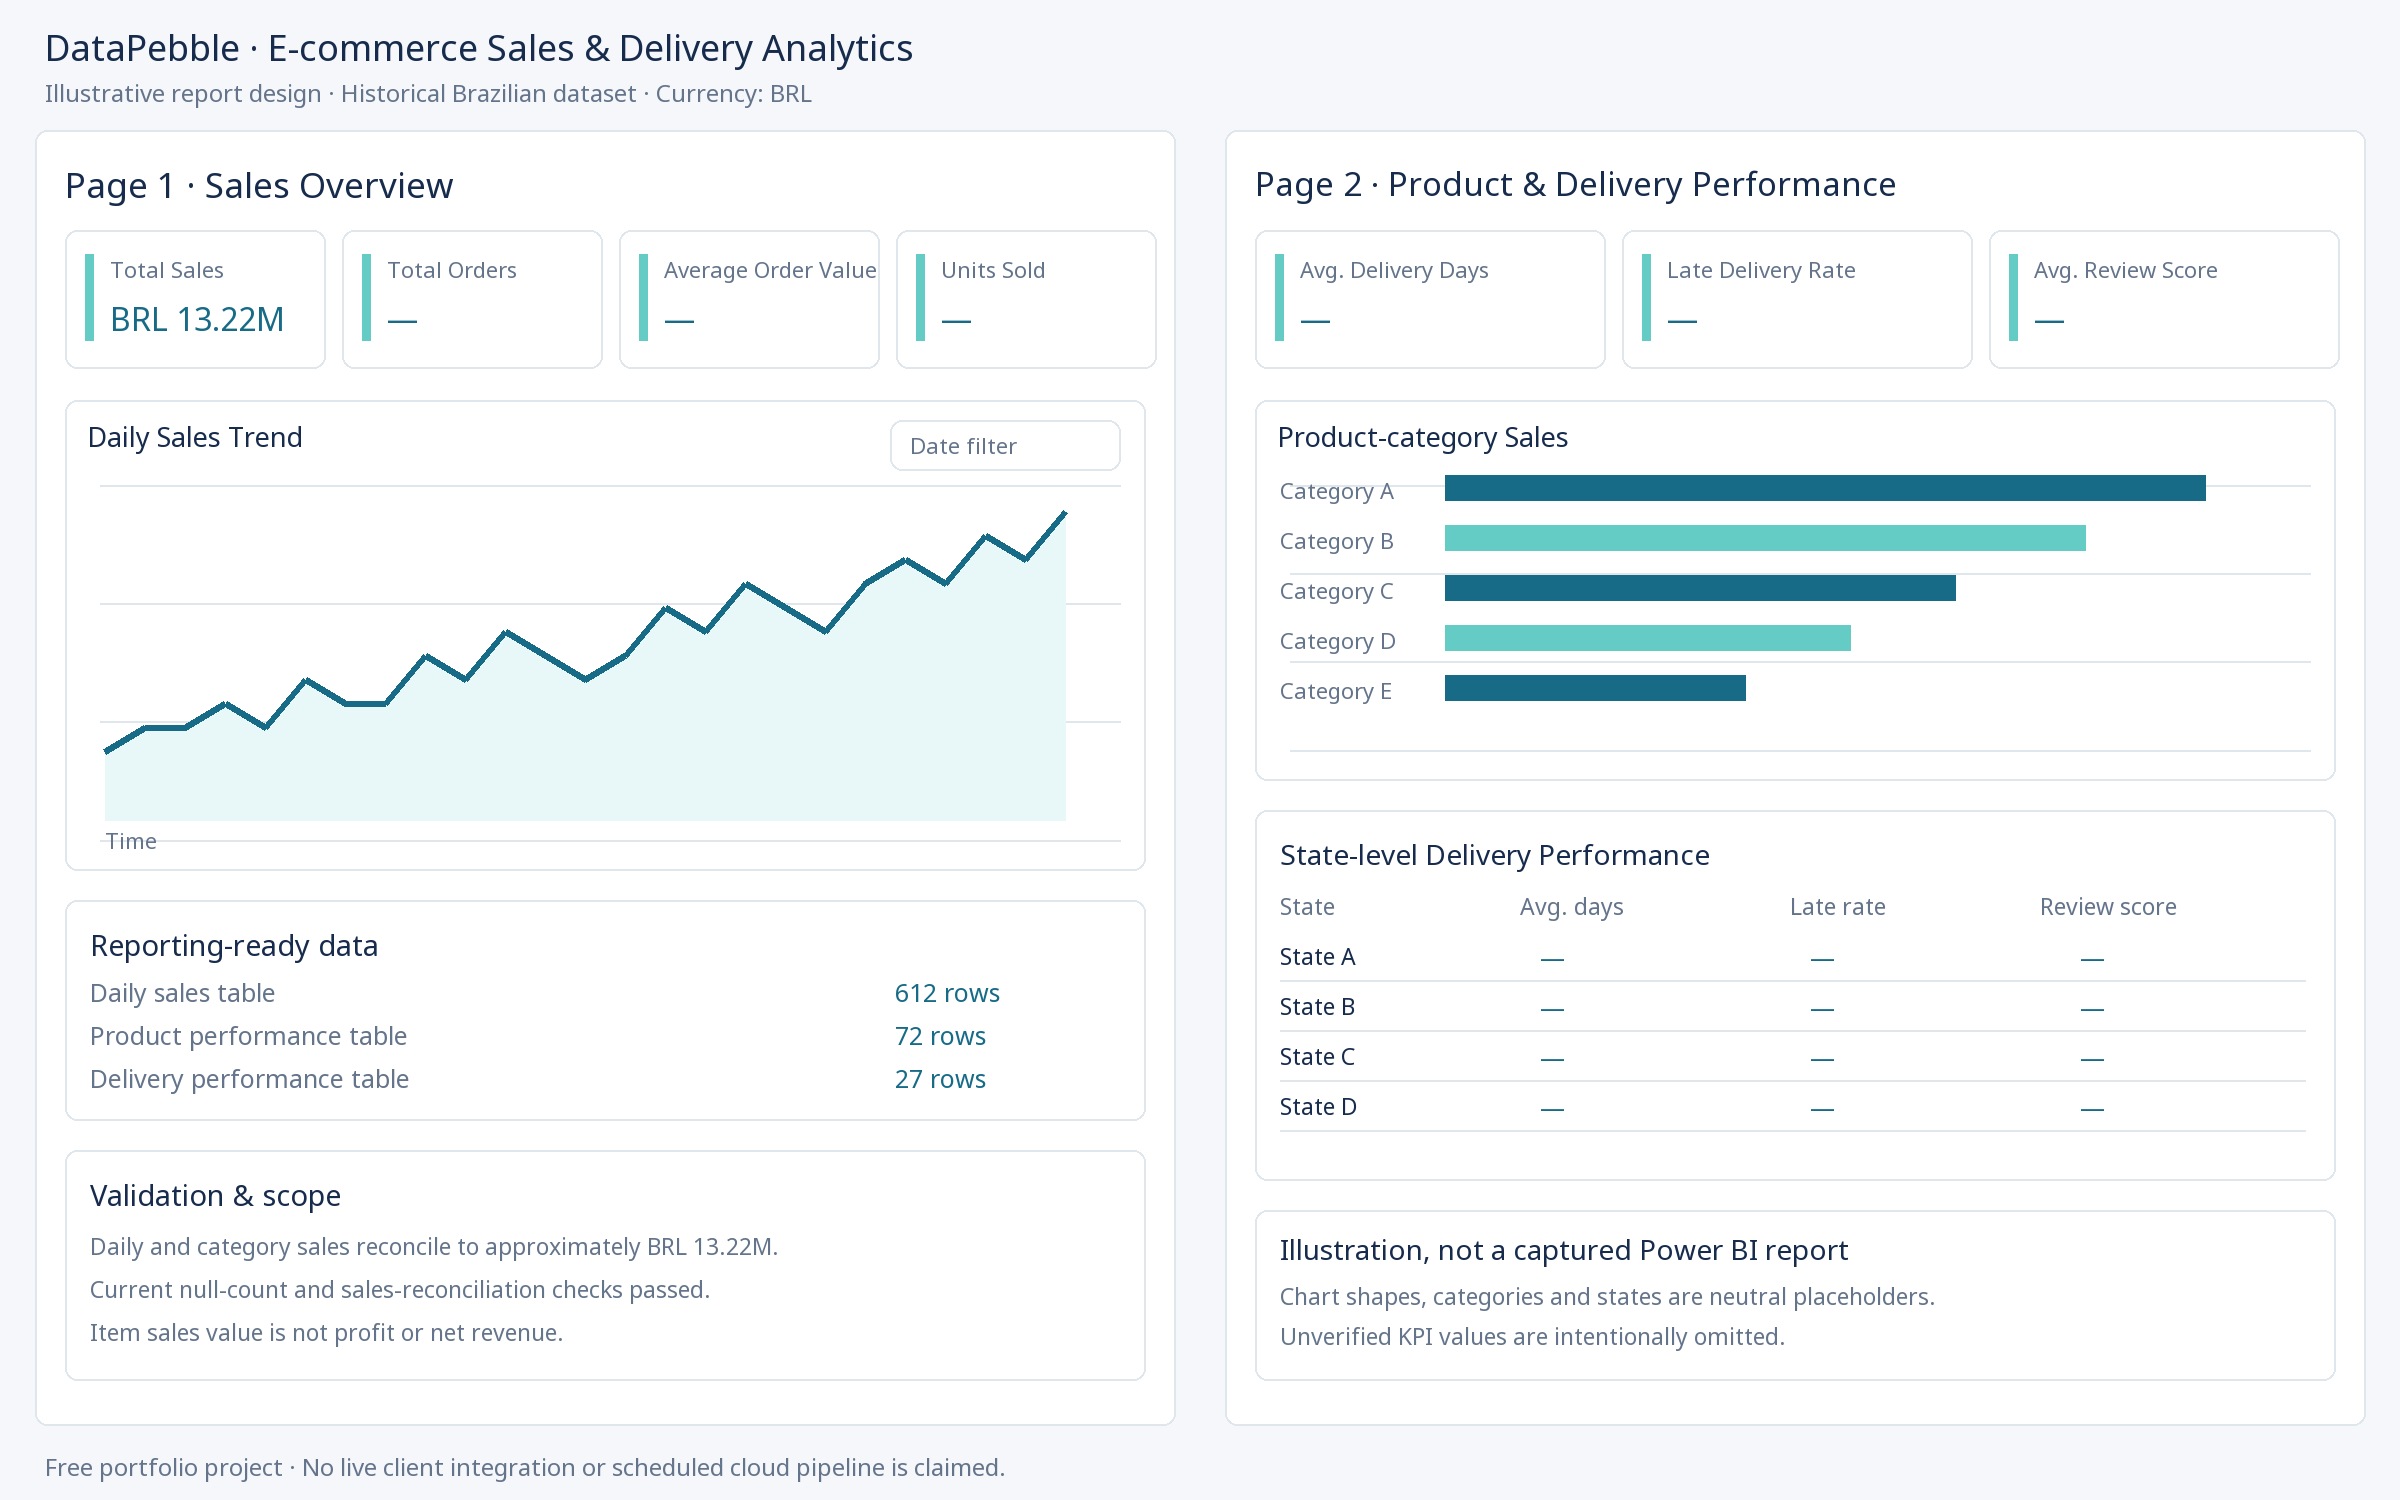
Page 1 · Sales Overview
- Total sales value
- Total orders
- Average order value
- Units sold
- Daily sales trend
- Date filtering
Page 2 · Product & Delivery Performance
- Product-category sales
- Average delivery days
- Late delivery rate
- Average review score
- State-level delivery performance
Verified project facts
- The processed daily sales table contains 612 rows.
- The product performance table contains 72 rows.
- The delivery performance table contains 27 rows.
- Daily sales and product-category sales reconcile to approximately BRL 13.22 million.
- The ETL validation script passed its current checks for null counts and sales reconciliation.
A successful reconciliation does not prove every transformation is error-free; this is not a complete production-grade audit.
Questions the project is designed to explore
- How sales change over time.
- Which product categories contribute most to sales.
- How delivery performance varies by customer state.
- How delivery performance relates to customer review scores.
Technologies
PythonpandasSQL / SQLitePower BIDAXCSV data processing and validation
Limitations
- The dataset is historical and represents Brazilian e-commerce, not a live client integration.
- Monetary amounts are in Brazilian reais (BRL).
- The sales measure represents item sales value and does not establish profit or net revenue after refunds and other adjustments.
- This demo does not prove a live, scheduled cloud pipeline.
- Raw dataset files are not redistributed on this website.
A public dashboard link will be added here once published.